


|
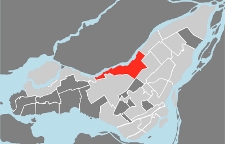
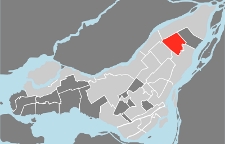
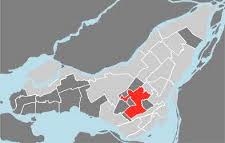
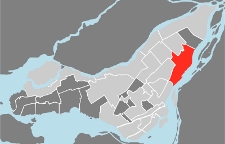
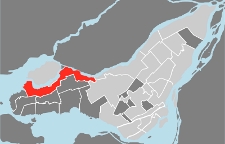
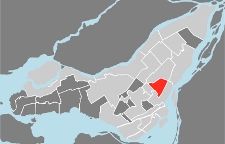
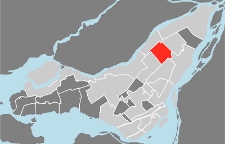
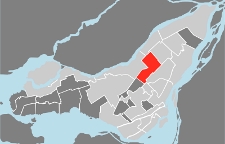
Montreal BoroughsMontreal-Nord BoroughMain Socioeconomic VariablesThe main socioeconomic variables of the Montreal-Nord Borough give you a first portrait of the people who chose to live in this particular borough. Of course, the geographical boundaries of the Montreal Boroughs are man made and have often been modified during the course of history. Nevertheless, each borough developed its own characteristics, its own personality and its own life. Some may be closer to your preferences than others, and this is fine, but they are all worth discovering. Élection Montréal / Montreal-Nord
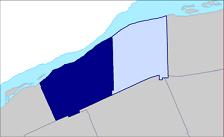
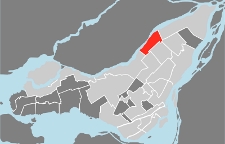
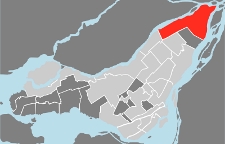
Marie Clarac / Montreal-Nord Borough
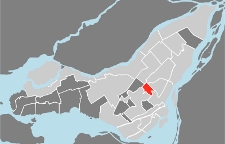
Population: A total number of 42,178 people live in the Marie Clarac electoral district of the Montreal-Nord borough. Young people represent 22% of the population while older people, 65 years old and over represent 20%. Households: There are 18,770 households in the district with an average of 2.2 persons per household. Homes with one person only represent 38% of all the households. Single-parent families represent 26% of all the families living in Marie Clarac. The dwellings of the district are distributed between 29% of owners and 71% of tenants. Languages: French is spoken in 83% of the households, English in 5% and a foreign language in 12%. Religions: 78% of the people living in Marie Clarac are Roman Catholics, 5% are non-religious and 5% are Muslims. Immigrants represent 25% of the total population, 13% of which arrived in Montreal between 1996 and 2001. Haiti (31%) Italy (23%) and Lebanon (6%) are the first three countries of origin of the immigrants living in this Montreal borough. Education: 41% of the 20 years old and over population do not have a high school diploma while 13% hold a university degree. The average income is $35,256, lower than the average in Montreal. In total, 38.1% of the people in households earn less than the yearly minimum income. Ovide Clermont / Montreal-Nord Borough
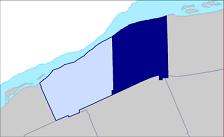
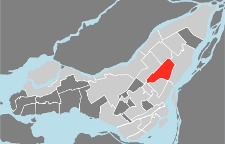
Population: A total number of 41,422 people live in the Ovide Clermont electoral district of the Montreal-Nord borough. Young people represent 25% of the population while older people, 65 years old and over represent 17%. Households: There are 17,600 households in the district with an average of 2.3 persons per household. Homes with one person only represent 33% of all the households. Single-parent families represent 29% of all the families living in Ovide Clermont. The dwellings of the district are distributed between 26% of owners and 74% of tenants. Languages: French is spoken in 81% of the households, English in 6% and a foreign language in 14%. Religions: 78% of the people living in Ovide Clermont are Roman Catholics, 5% are non-religious and 3% are Muslims. Immigrants represent 28% of the total population, 20% of which arrived in Montreal between 1996 and 2001. Haiti (35%), Italy (28%) and Morocco (3%)are the first three countries of origin of the immigrants living in this Montreal borough. Education: 44% of the 20 years old and over population do not have a high school diploma while 11% hold a university degree. The average income is $35,298, lower than the average in Montreal. In total, 40.8% of the people in households earn less than the yearly minimum income. To get more information, make a municipal service request or file a complaint, you may visit Réseau Accès Montréal online. You may also contact them by phone (simply dial 311), by mail or by visiting one of their service counters. During election time or during any other time, you may wish to visit Élections Montréal or Le directeur général des élections du Québec or Elections Canada: Chief Electoral Officer of Canada for information on our municipal, provincial or federal electoral systems. Thank you for visiting Montreal-Nord Borough. Montreal-Nord District (MBK) Local Street Map of the Borough (PDF)
Exit Montreal-Nord Borough
|
Montreal Boroughs
What Borough
Am I In?
Ahuntsic-Cartierville
 Anjou
Anjou
 Côte-des-Neiges-Notre-Dame-de-Grâce
 L'Île-Bizard-Sainte-Geneviève
 Lachine
 LaSalle
 Mercier-Hochelaga-Maisonneuve
 Montréal-Nord
 Outremont
 Pierrefonds-Roxboro
 Le Plateau-Mont-Royal
 Rivière-des-Prairies-Pointe-aux-Trembles
 Rosemont-La-Petite-Patrie
 Saint-Laurent
 Saint-Léonard
 Le Sud-Ouest
 Verdun
 Ville-Marie
 Villeray-Saint-Michel-Parc-Extension